Discovering Rainforest Locations Activity - Tweaked for Unpacking Colors on Maps with 5th graders :)
This article is part of the “LP Tweaks” blog series showcasing how small adjustments to the questions, organization, and/or data moves within your existing curriculum can help align the learning to different data skills for your learners. This original lesson is strong, and the intention is not to communicate otherwise but rather to share how you could adjust things for a different desired outcome.
Written by: Naomi W
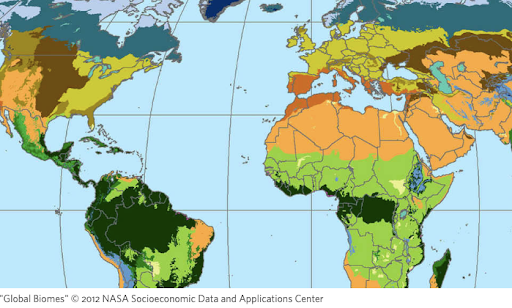
Years ago you found the great data-based lesson “Discovering Rainforest Locations” from the California Academy of Sciences. The focus is on using real scientific data to map worldwide temperature, precipitation, biodiversity, and soil nutrient levels to predict where on our planet rainforests are located. It is a fun and visual way for your learners to work on concepts related to 5-ESS2-1. And boy do your students like looking at things about the earth!
However, based on your student's struggles with maps in the last unit you want to give them more time to deepen their understanding that we “Color Different Parts of a Map Based on the Values of an Attribute” not to match the color in the real world. You sense that if your students can practice this more deeply it will help with their data analysis and interpretation skills (see Building Blocks for Data Literacy to explore the corresponding data skills of these areas more).
You are torn, you like the lesson from the California Academy of Sciences and your other colleagues are using it, but you are worried the questions aren’t directly getting at the data skills your learners need to practice at this point in the year, but the content is. What do you do?
Let’s check out some easy optional tweaks to make the lesson more of what you are looking for now.
First, you already review some basic map skills beforehand with your students as you have found this helpful to orient your students. For example, on the Student Worksheet, you have the students label the Equator, Tropic of Cancer, and Tropic of Capricorn. As an engaging prompting question, you like asking something like: What do these 3 lines of latitude have to do with Rainforests? It is fun to hear what the students share (and helpful for you to know where they are coming from)
Here is an example of how we can add a few questions to the lesson to more directly help your current students practice data skills around colors on maps, aka what we know they are weaker on (or we are more interested in targeting this specific data interaction) at this point in the year.
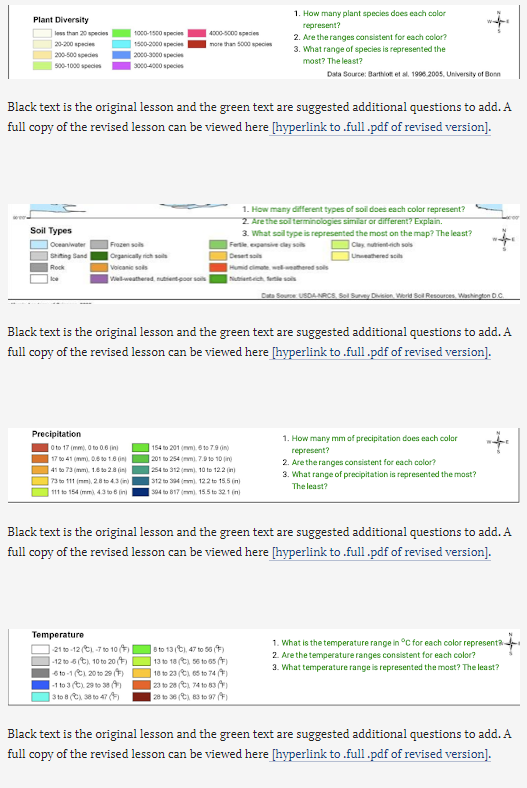
The questions are designed to help students “Visualize Data ” more strategically and specifically – in grades 4-6 in appropriate ways – before they jump in during step #5 and translate information from the World Data Maps to their Blank Maps. They do not add a large amount to the workload for the students, but instead, provide more targeted practice of how to stop and take in the information on a map before diving into answering questions from the map.
The new questions help students learn to assign or identify colors to specific attributes or ranges of an attribute. Data is not always defined by quantitative values. Students need to learn to use qualitative values as well. And before we ask them to transfer that information to a new map, it can be helpful to make sure they know what they are actually looking at.
Even though the students have looked at maps before, they need to practice looking at different values of an attribute and assigning a color to them. When working with multiple maps, each showing a different attribute, they need to realize they can use the same colors to represent the different aspects of different attributes on different maps, as long as the attributes are marked appropriately in a key/legend. This will help set students up for more success in visualizing data on Maps.
This line of questions can also be a jumping-off point to help students to consider cause (e.g. which of the four factors (rainfall, temperature, biodiversity, soil) caused the rainforest to develop?,) and effect (e.g. which of these factors were caused by the rainforest?).
Therefore, with the addition of 12 new questions (3 per attribute map), you can continue to use this tried-and-true lesson you found years ago while also better aligning it to your current learners' needs and/or your desired focus areas for your learners to practice data skills.
How about that for a win-win? Still using a lesson that you like but with a more strategic data focus to help learners build their skills :)
Is this the only way to tweak this lesson? Certainly not!
Other adjustments in this lesson could also help students that are needing to work on their ability to “Compute or Transform Attributes” skills at this time of the year. So rather than just measuring temperature ranges in 0C and precipitation in mm, you could adjust the questions to compare the ranges of the data to include 0F for temperature and inches for precipitation. They work on their data skills AND math computational skills all at once! Maybe, this could be an opportunity to use the same data across subject areas. Aka, you work on the color representation part in science class and the computational side in math class :)
So many possibilities!
The point is that with a better sense of what we are working towards with data skills (see Building Blocks for Data Literacy to explore the range of data skills K-12 our learners should be working to master) we can be empowered to make our existing curriculum work better for us and our learners…rather than needing to find or write all new curriculum.
Give it a try! What in your next lesson with data can you slightly adjust to make it better hit the skills you want your students to practice? Contact us to let us know how it goes.
The full original lesson plan and resources for this activity can be found here:
